Overview
If there is at least one data source, the user can addDiagrams and Table Views to individually analyze and filter the data.
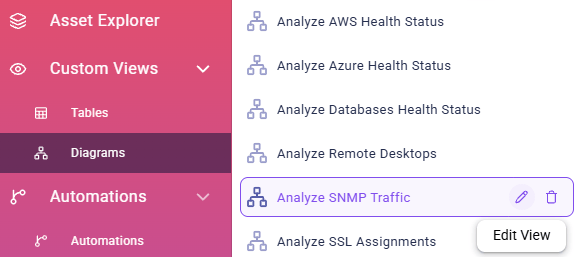
An overview of all views is available by navigating to the Custom Views section in the sidebar. There, the subpages Tables and Diagrams list all existing views of that kind.
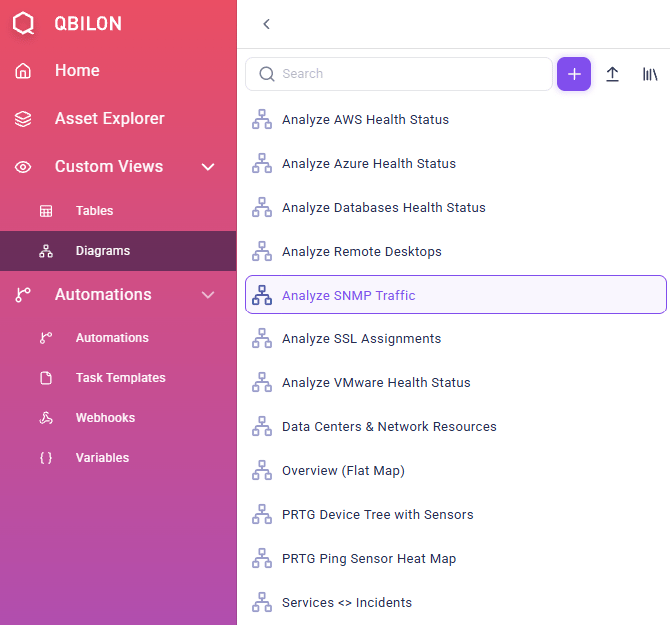

Tables or Diagrams–, users can either open a specific view by clicking on it or they can directly edit or delete them by choosing one of the hover over icons next to the view name (“pencil” and “trash bin”).