General
Clicking onCustom Views in the left sidebar and selecting Table displays all available tables views. Clicking on a list item opens the corresponding view.
A general toolbar is located on the top right.
On the right side, there are four tabs:
Filtersallows to select which assets/relations are shown and to create analysis rules,Detailsshows all available information for one asset/relation (row) selected within the table on the left,Activityshows the change history (audit trail) for a specific instance andViewgives details on the table view definition itself.
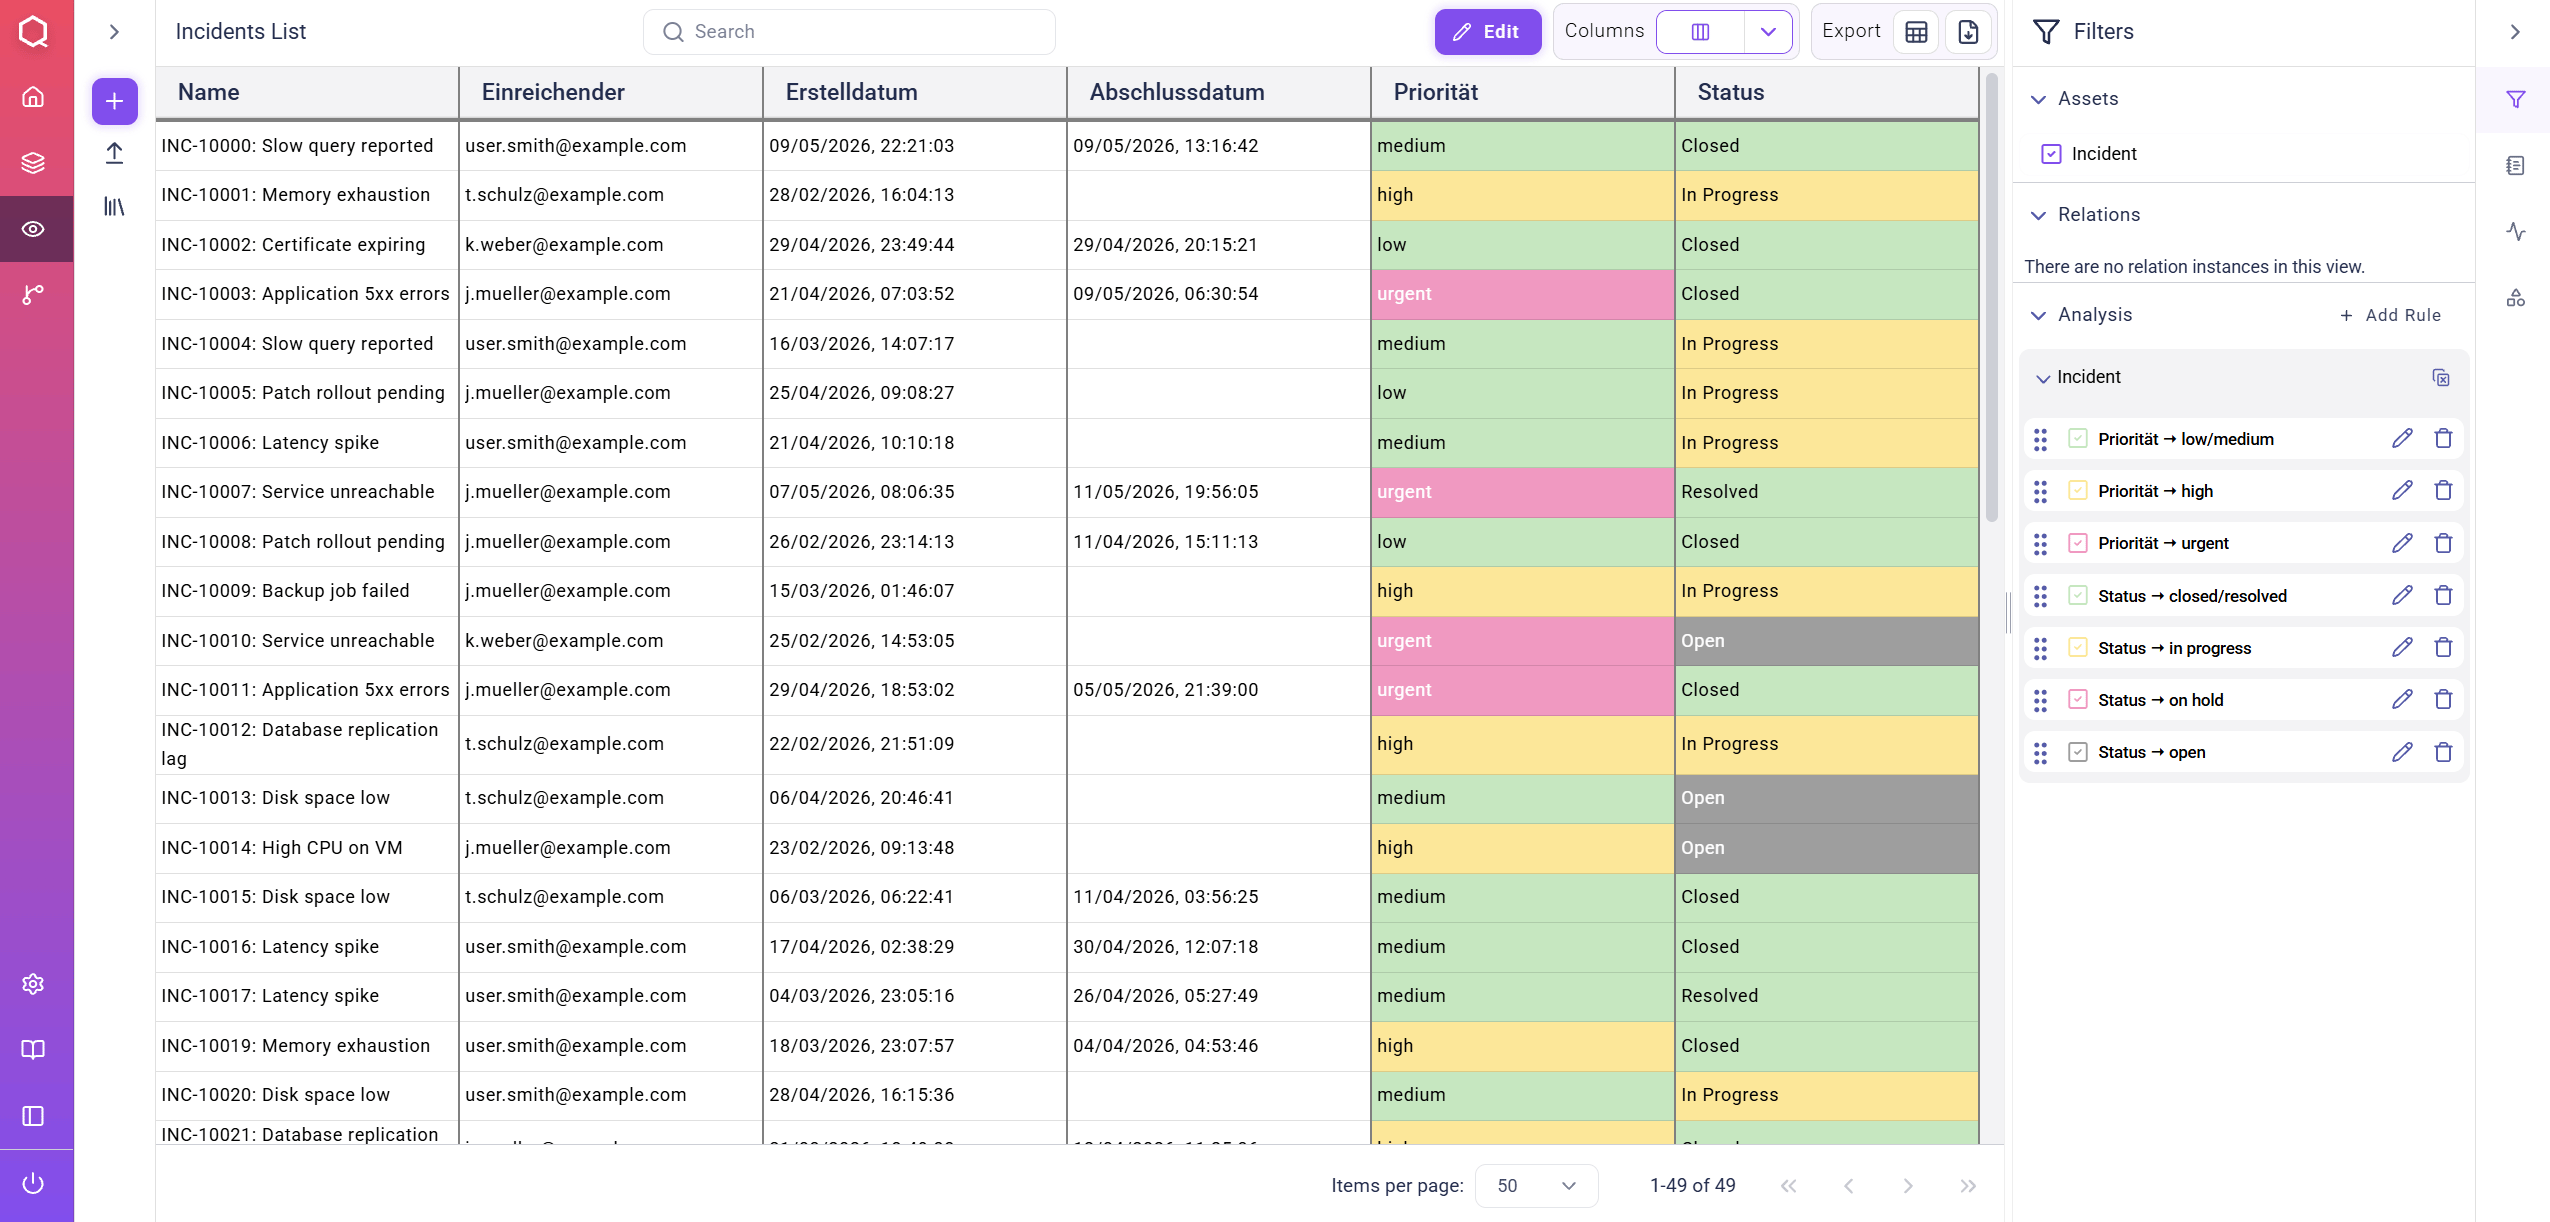
Table Toolbar
In the following list, the functions of the top toolbar within diagram views are explained from left to right:View TitleandSearch Bar: finds, highlights and focuses the view on searched assets
Edit Mode Toggle: activates or deactivates the creation and modification of assets, relations and their propertiesEdit – Add Asset(only when “edit mode” is activated)Edit – Add Relation(only when “edit mode” is activated)Edit – Save View as Default: Persist the current view configuration (selected filters & analysis rules) as standardEdit – Edit View: jump directly to the “edit view” window for this specific view

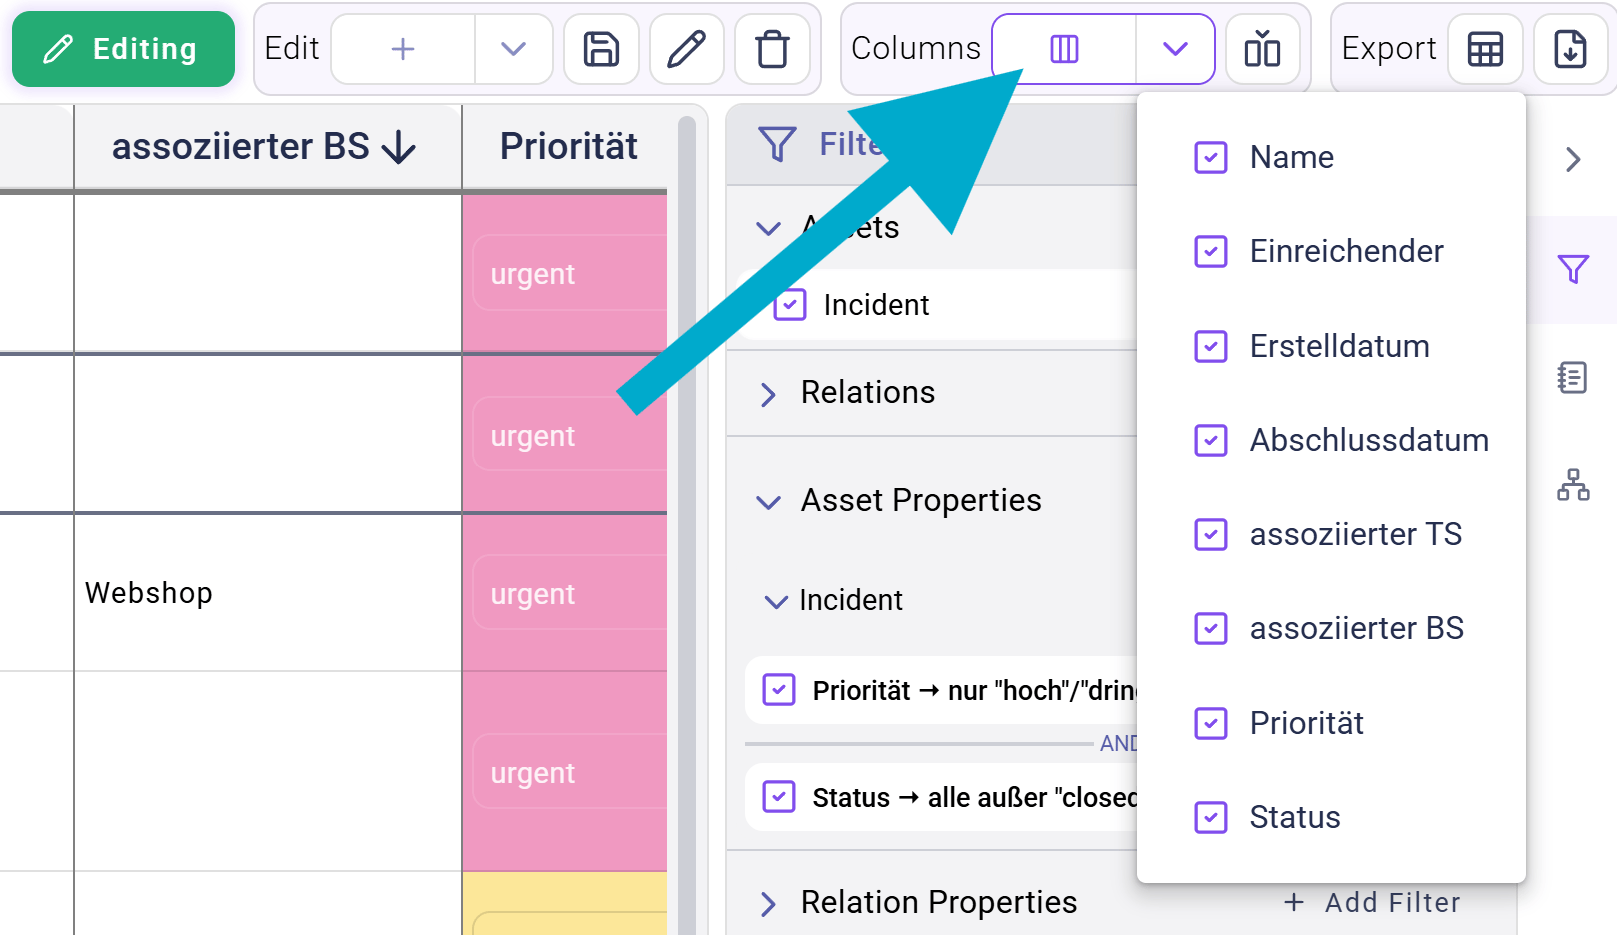
Show/Hide Columns: select or deselect which of the available columns are shown in the viewAdd Column: add a column to the table view that shows the values of a specific property or relation
Export – Download Table as CSV: download the current view as CSV fileExport – Download View Definition: download the current table view definition as “qb file”.
Adding Columns
Adding columns to a table view is possible when theEdit Mode is activated.
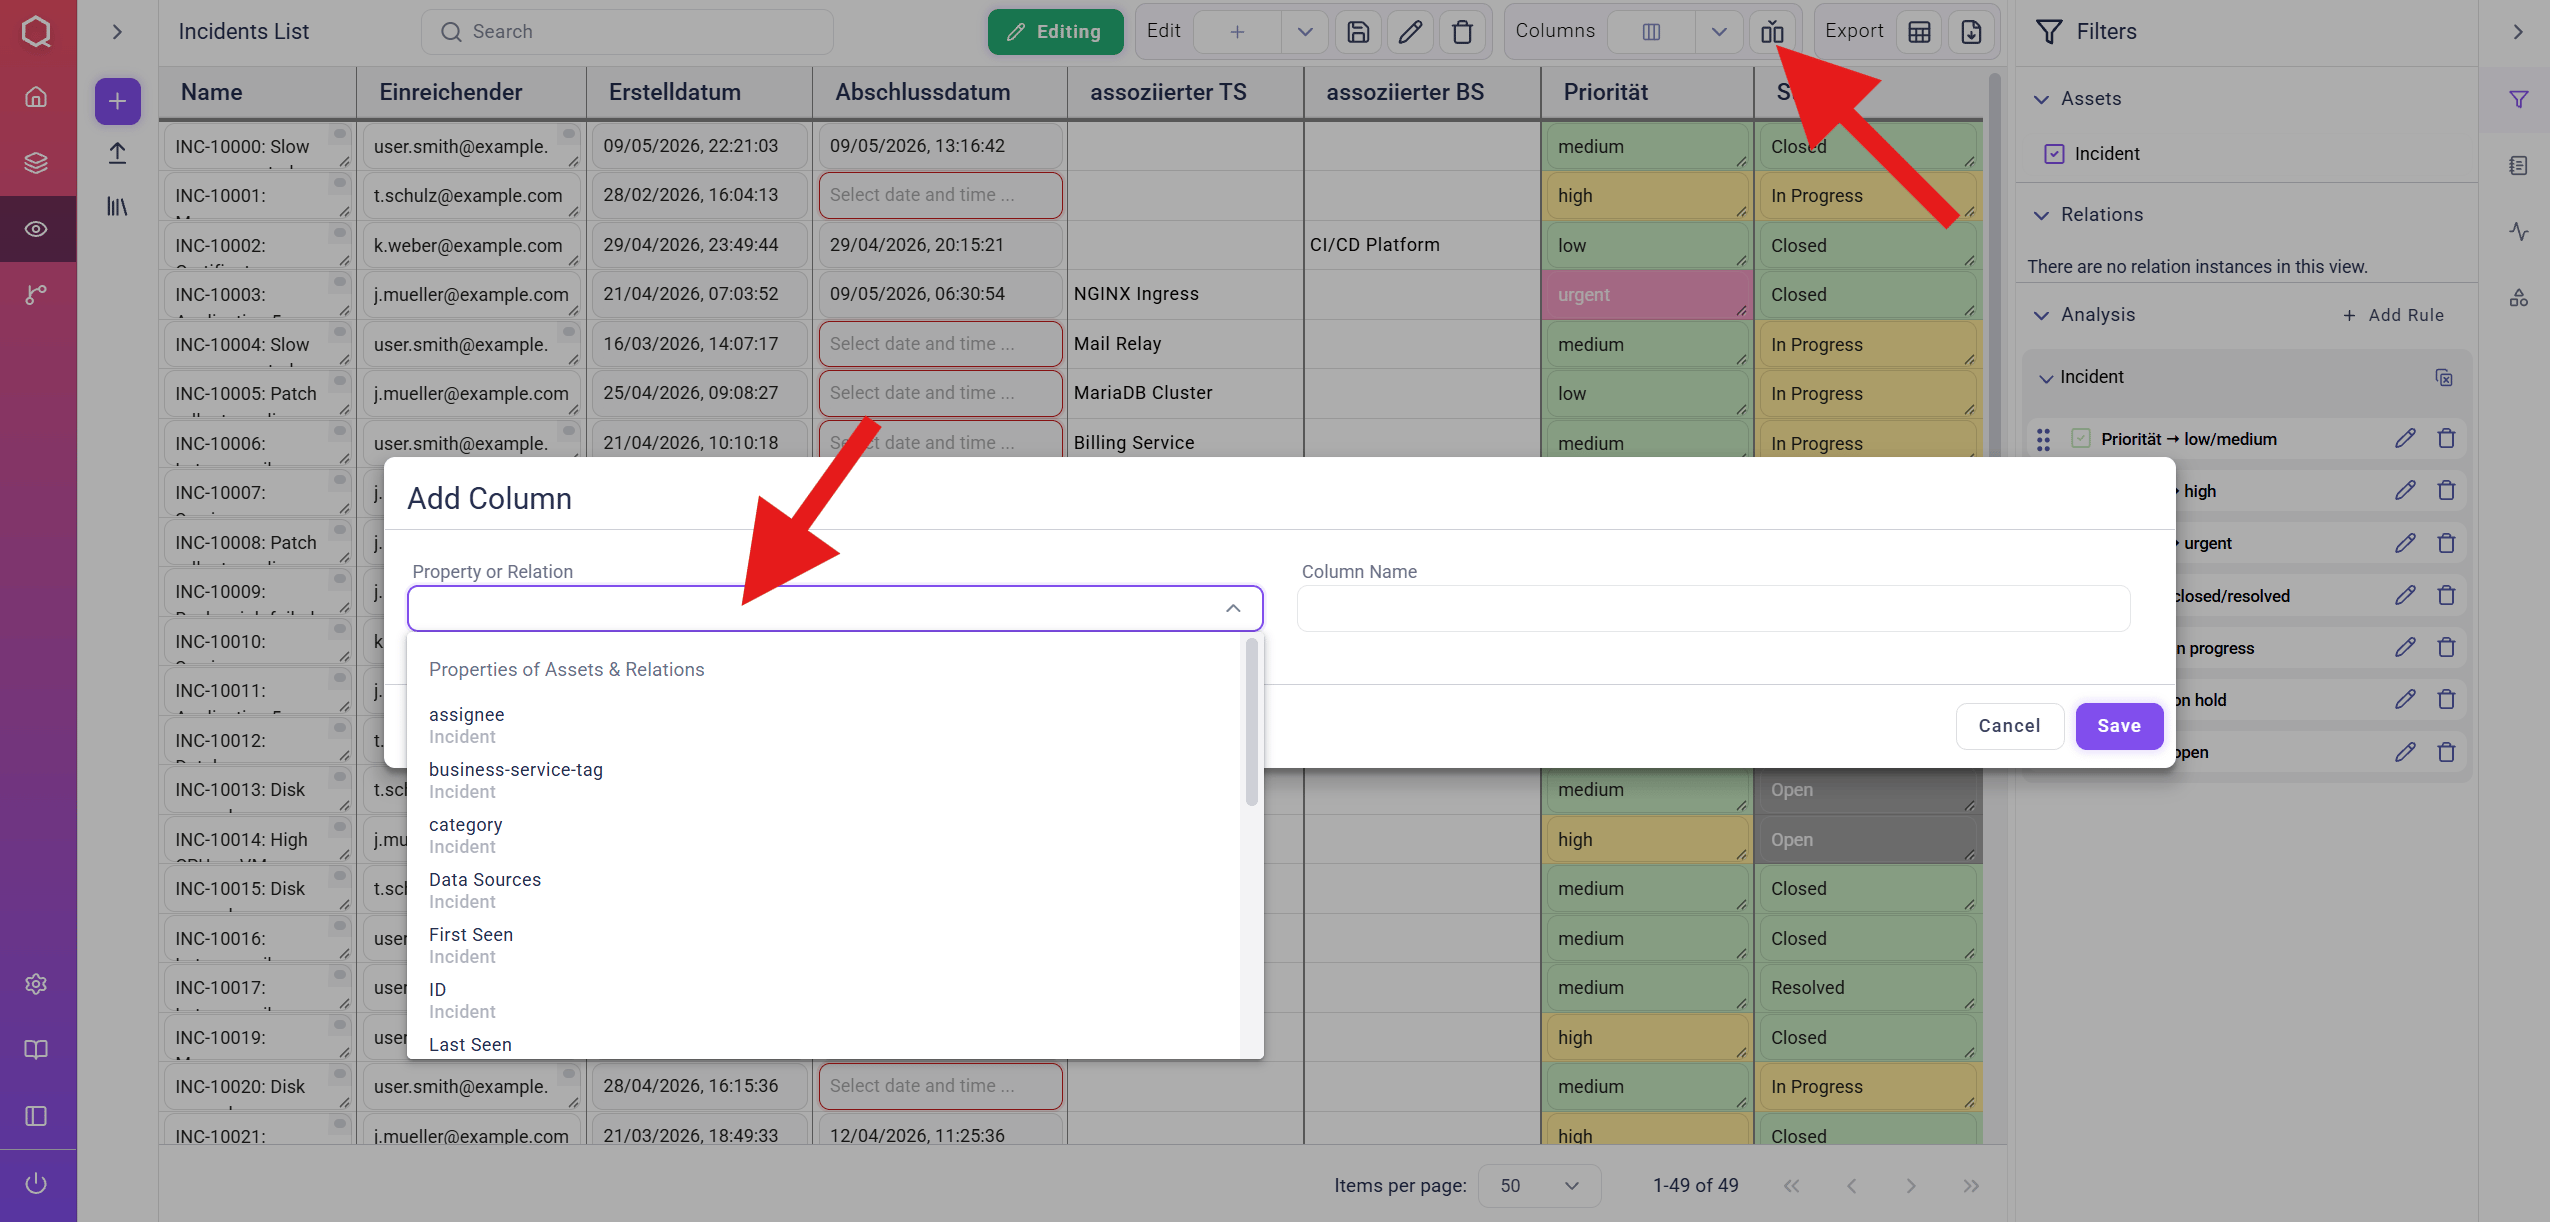
To add a column, click on Columns in the toolbar and then on the + Add Column button. Within the appearing dialog window, additional columns can be added by selecting a property of an asset/relation from the dropdown list. The new column is shown after typing in a Column Name and clicking on Save.
Modifying Assets/Relations
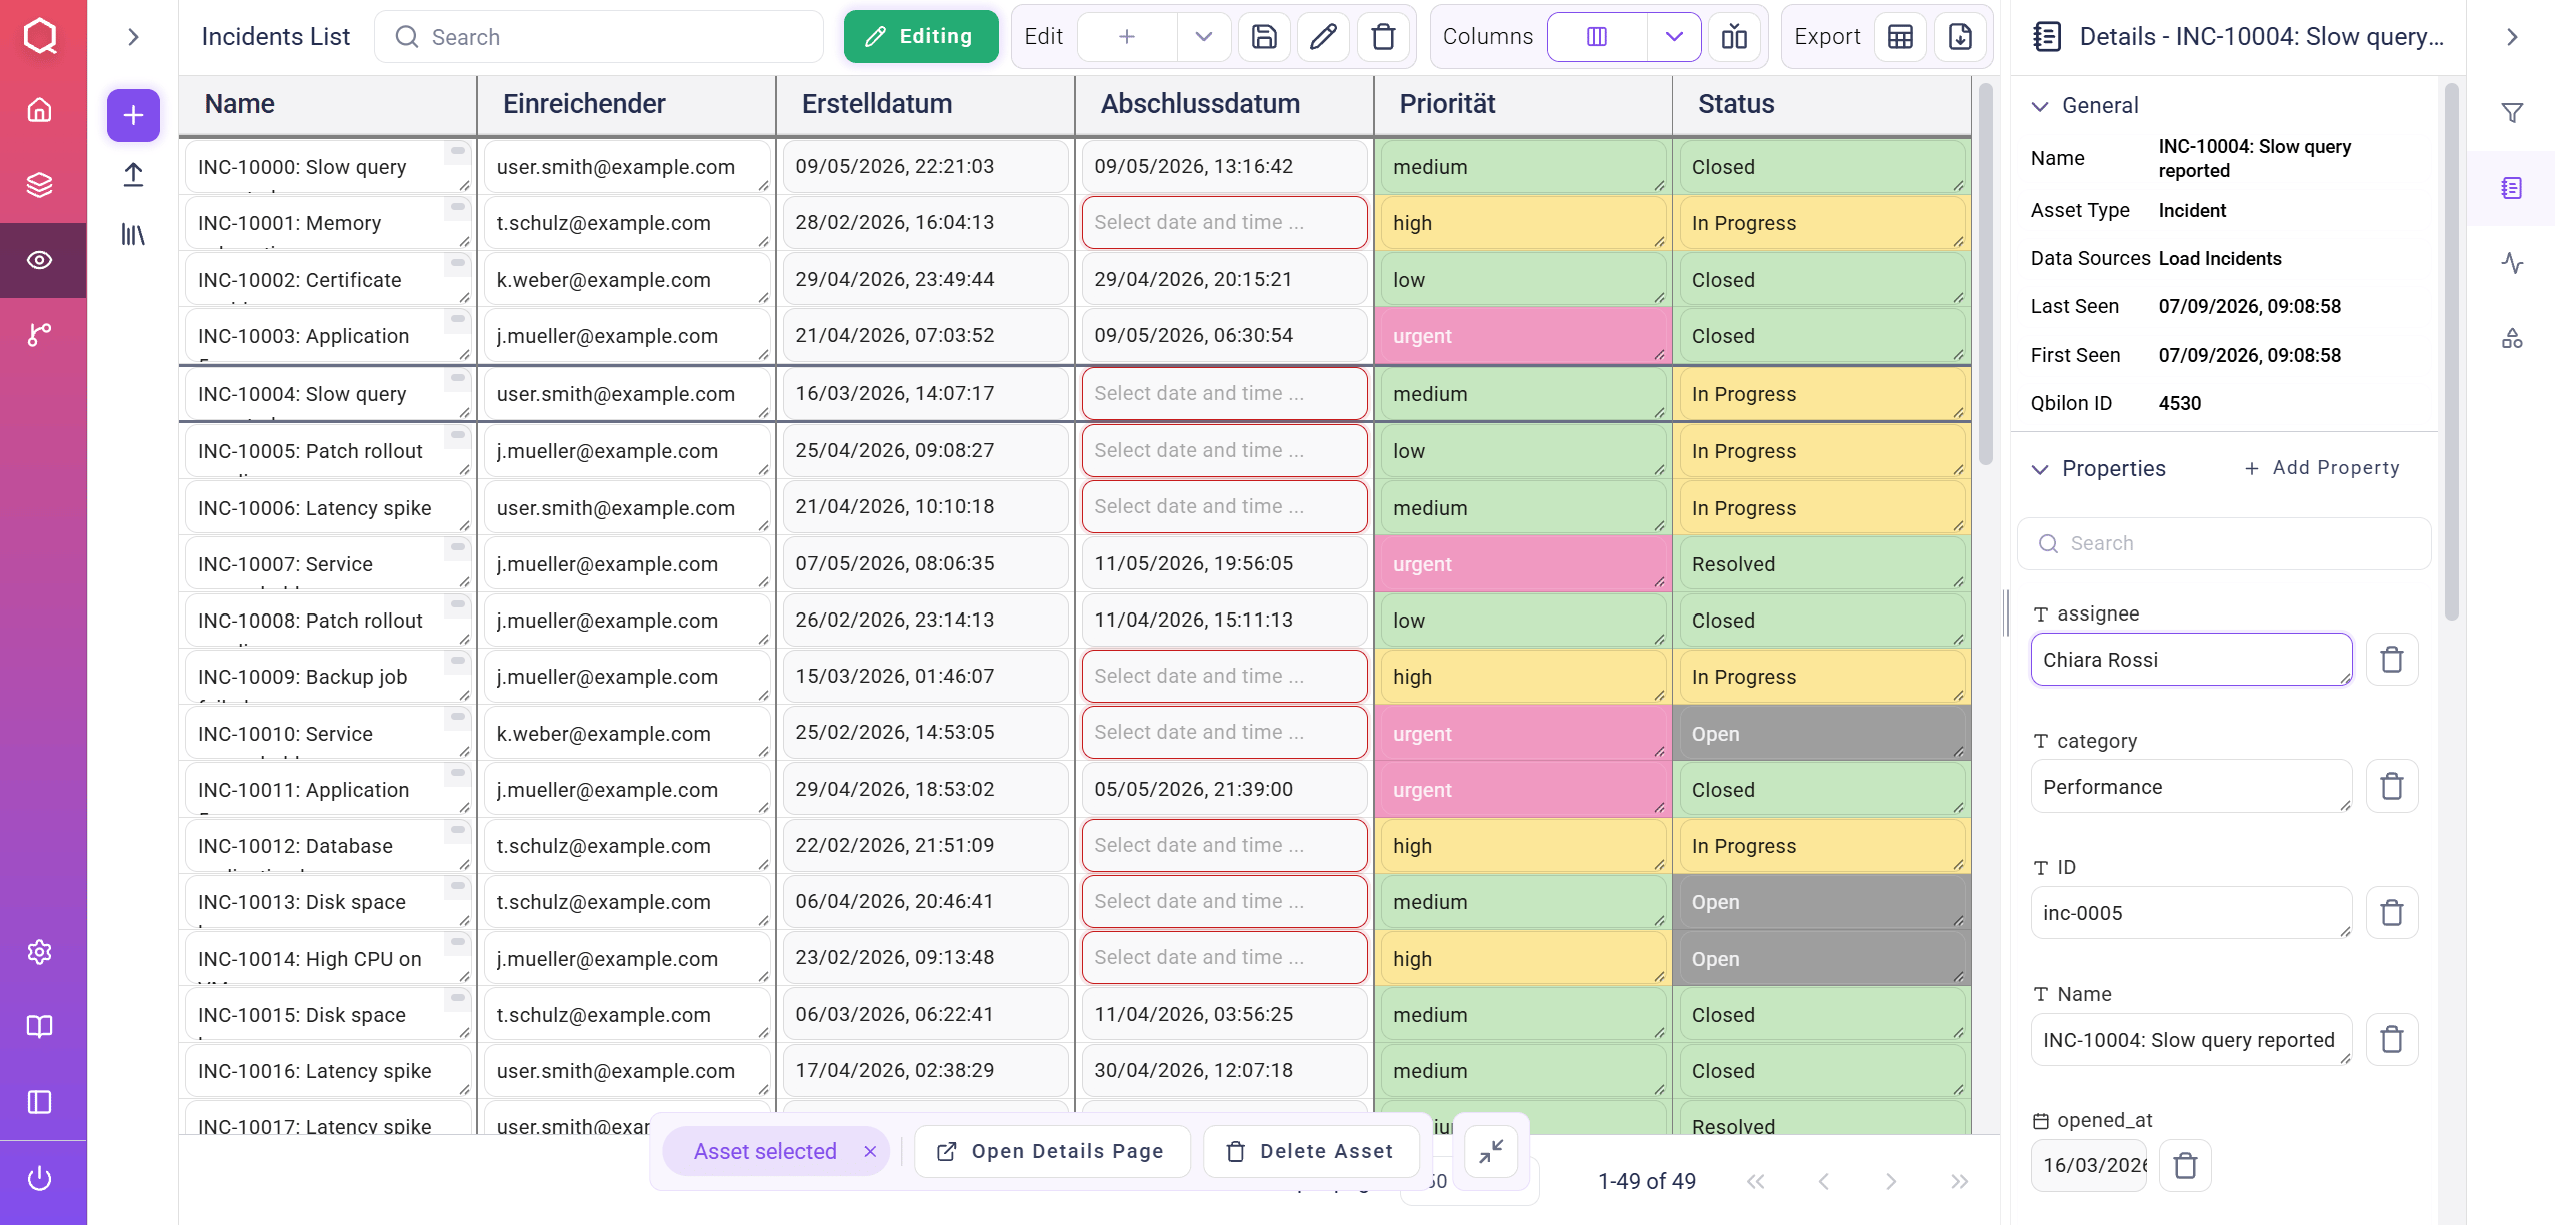
When theEdit Mode is activated, modifiable asset/relation properties are highlighted with a dotted rectangle around them.
An asset’s or relation’s properties can be directly edited by clicking on the specific cell, altering the content and clicking on the checkmark button next to the input field (or hitting the ENTER key).
Alternatively, the properties of a selected row (asset or relation) can also be modified within the Details tab on the right side.
Analysis
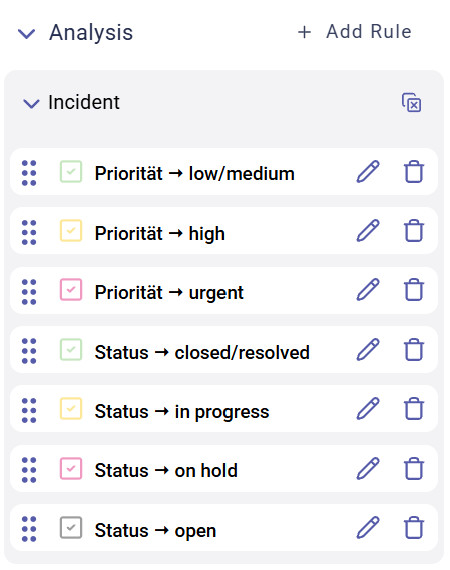
Within theAnalysis sections in the right sidebar, the + Add Rule button can be used to create analysis rules. Such rules are used to highlight assets that fulfill certain conditions depending on their properties.
Creating new analysis rules is similar to creating filters:
Asset: the asset type for the analysis rule- Color Circle: color used for highlighting assets meeting the analysis rule conditions
Property: the asset type’s property used to later colorize the displayed relationsOperator(general): independent from the type of the selected property, these “general” operators are always available:is equal to: returns “true” if the property’s value corresponds to the entered/selected value,is not equal to: returns “true” if the property’s value does not correspond to the entered/selected value,exists: returns “true” if an optional property is existing for a specific asset/relation instance
Operator(specific): depending on the type of the selected property (Number,Text, …), different “datatype specific” operators are in addition available:- for text properties:
contains (not),matches (not)andis empty, - for number properties:
is >/< thanandis >=/<= than, - for
DateTimeproperties:before,after,within lastandnot within last.
- for text properties:
Value: the value to be set for the new property (clicking on the input field shows existing values)- Via
+ Add Condition, any number of additional conditions can be defined for the analysis rule. If multiple conditions are defined, the user can choose if …- colored assets have to fulfill every defined condition (connecting conditions via
AND) or - if they only have to meet one of the conditions (connecting conditions via
OR).
- colored assets have to fulfill every defined condition (connecting conditions via
Create adds a new analysis rule to the Analysis list and automatically activates it.
If assets fulfill the conditions of more than one analysis rule, then –depending on the rule configuration– either the entire row or the corresponding cell are colorized according to the topmost activated rule (ascending priority).