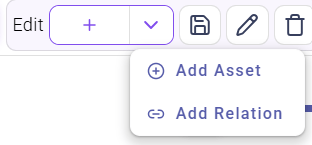
Edit Mode in Diagram/Table View
Overview
Diagram and table views feature an “edit mode” that allows adding, modifying and deleting assets, relations as well as their properties. The edit mode can be enabled by clicking on theEdit toggle button in the toolbar on the top. After activation, a + button is shown next to the edit mode button. Clicking on it shows the specific buttons for adding a new asset (Add Asset) and a new relation (Add Relation).
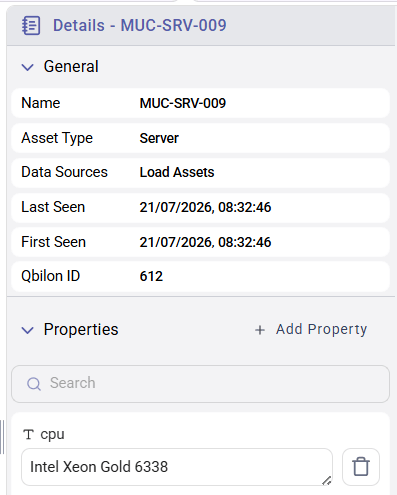
+ Add Property button appears in the Details tab of the right sidebar after activating the edit mode (and clicking on a specific asset or relation). Now, all modifiable properties are shown with a dotted rectangle surrounding them. There is also a delete icon (bin) shown next to each (non-mandatory) property.
+ Add Property action when “edit mode” is activated.
Adding Properties
It is possible to manually add properties by clicking on the+ Add Properties button in the Properties headline bar.
Hint: This can only be done, if not all of the properties of a specific asset/relation have not been defined yet, i.e. there is still an unused property available.
If the message No unused properties available. is shown, then the user has to create a new property type for this asset/relation type first (see Data Schema section).
After that, the first step is to choose a property type to define. Then, the value of this property can be entered. The input value has to match the property’s content type (number, text, Boolean or DateTime). By clicking on the checkmark icon, the property can be saved.
Modifying & Deleting Properties
Properties can easily be modified by just clicking on their value (the input field surrounded by a dotted line). After modifying the value, changes are automatically saved as soon as the input field is left, i.e., the input field loses focus. Deleting a property can be done via the “garbage can” icon on the right side of the row.Manually Creating Assets
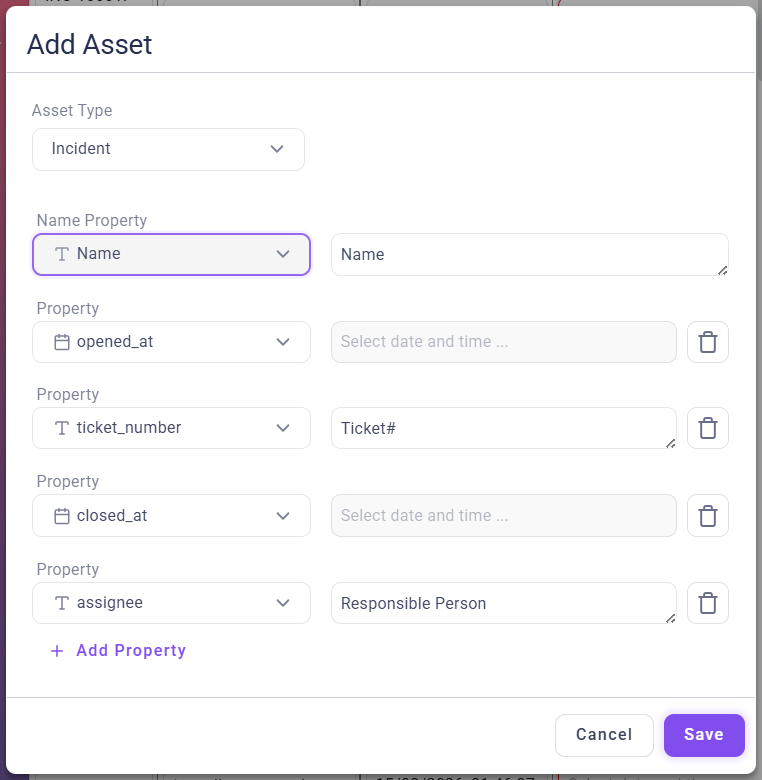
New assets can be created by clicking+ and Add Asset in the top toolbar.
Afterwards, the following information can be defined:
Type: The “category” of the new assetName Property(mandatory): the name value that is later used as “primary tag”- Via
+ Add Property, further properties (and their values) can be set for this new asset. Therefore, the dropdown menu lists all available properties defined for the according asset type. - Finally, clicking on
Savecreates a new asset whileCanceldiscards any changes made.
Manually Deleting Assets
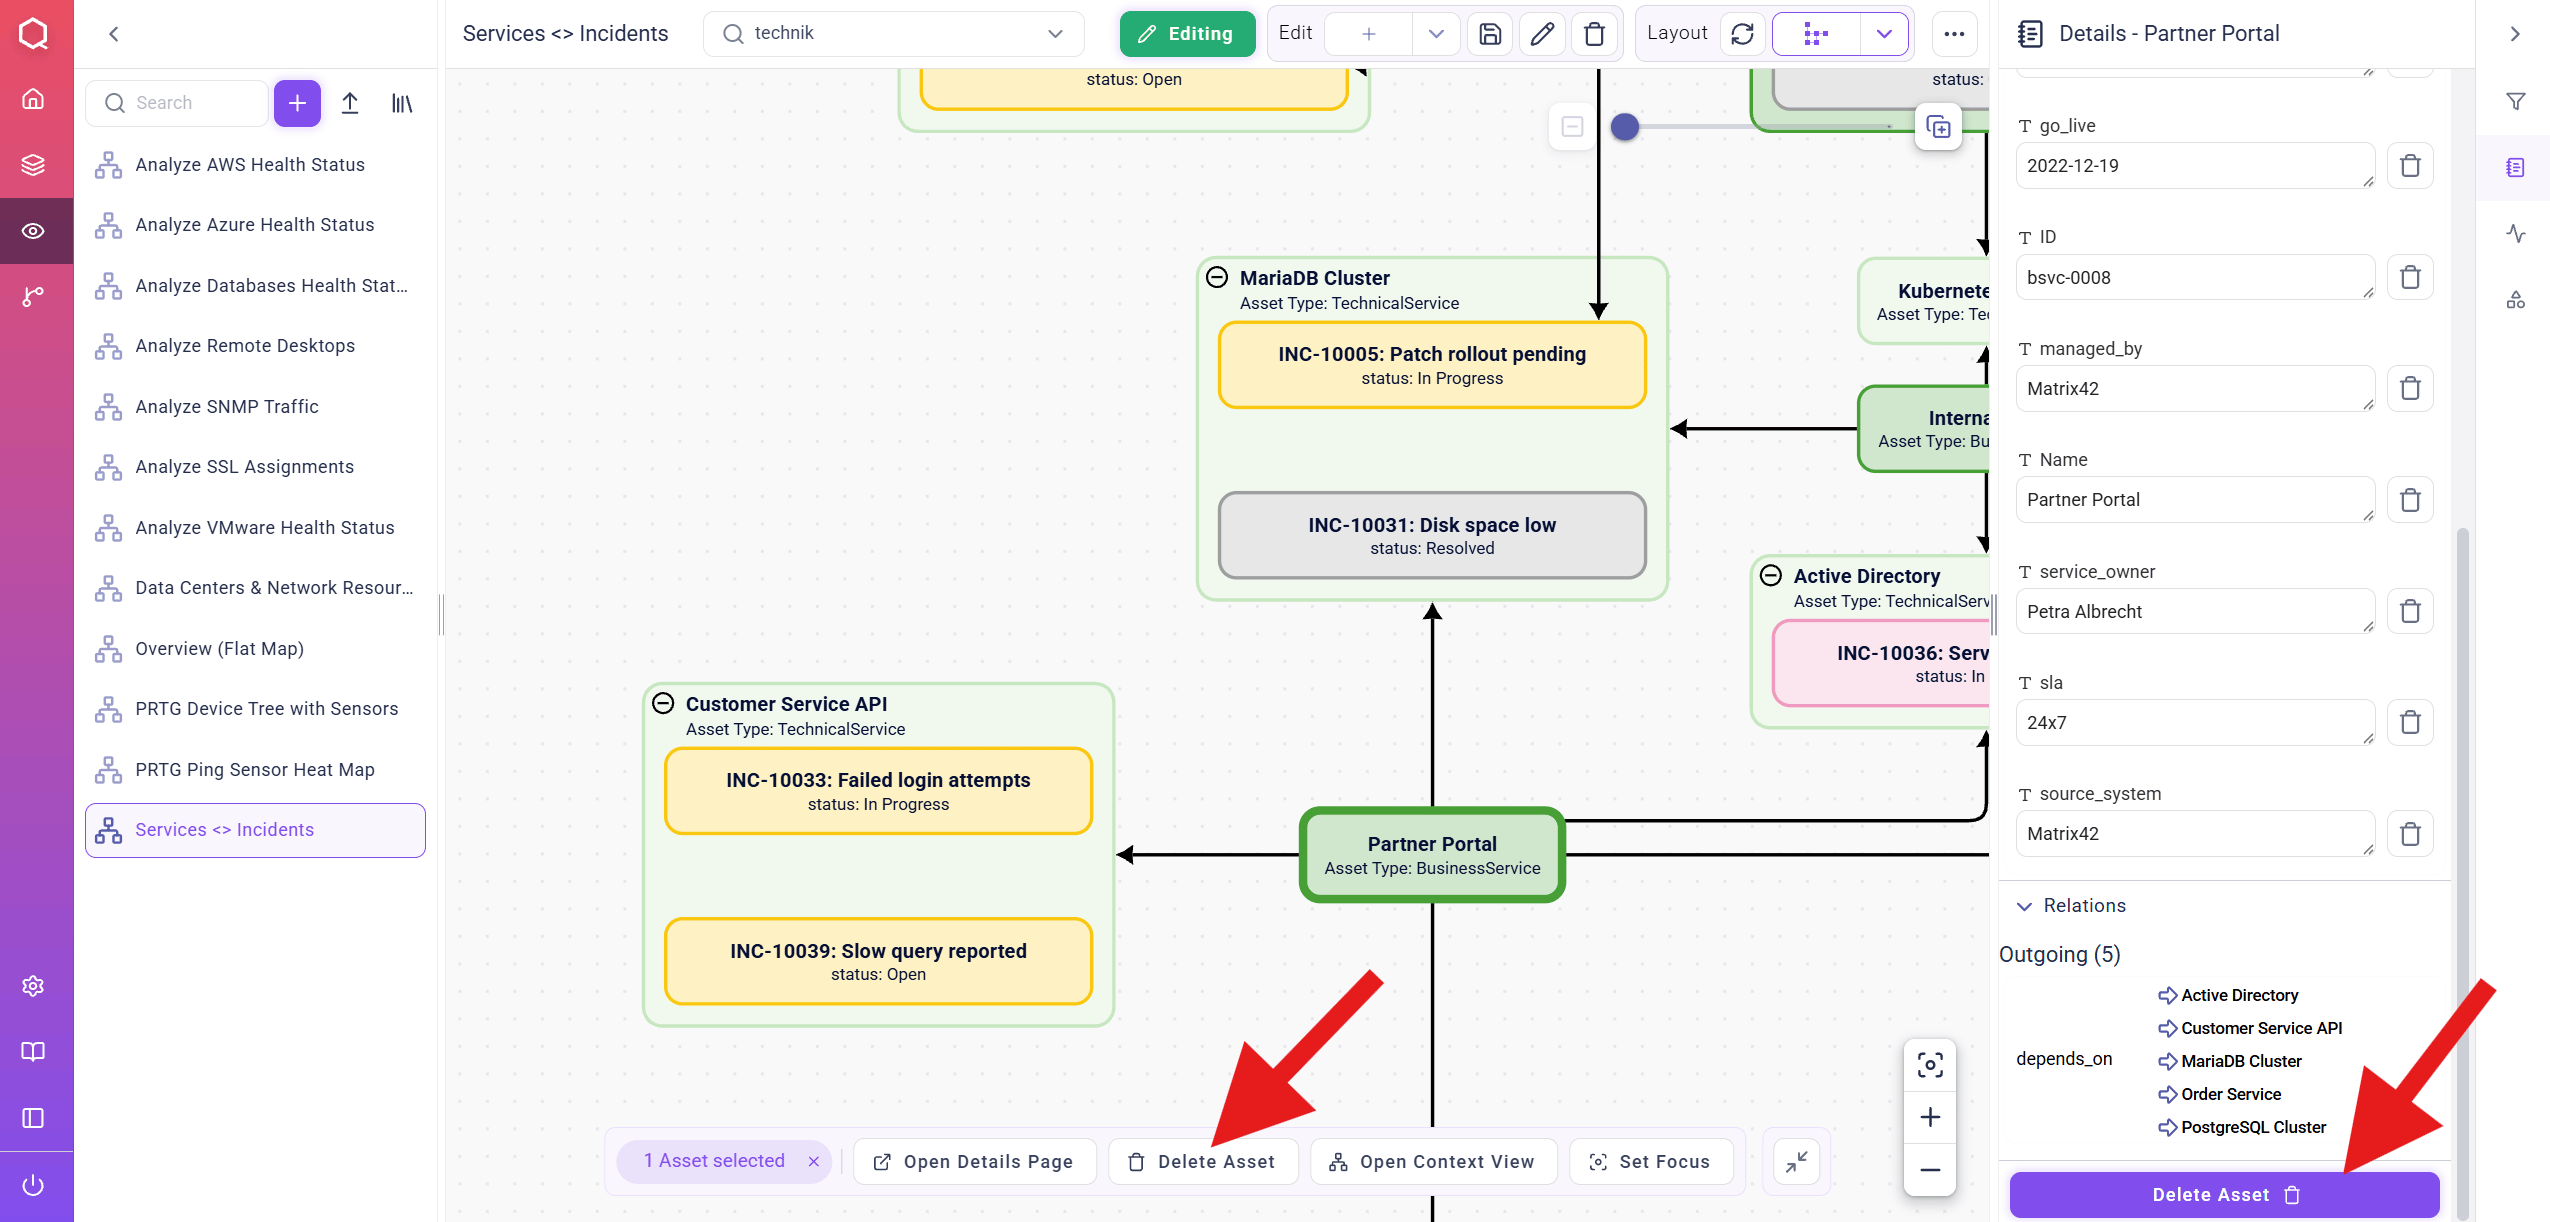
There are two ways to delete an asset:- Via the hover menu: clicking on the specific asset opens the hover menu on the bottom that provides the
Delete Assetfunction. - Via the
Detailstab: Clicking on an asset opens the asset details on the right sidebar, which provides anDelete Assetfunction on the bottom.
Details panel (right arrow)
Manually Creating Relations
New relations can be created by clicking+ and Add Relation in the top toolbar.
Afterwards, the following information can be defined:
Type: The “category” of the new relationSource AssetandTarget Asset: the “origin” and “destination” assets of the relationName Property(mandatory): the name value that is later used as “primary tag”- Via
+ ADD PROPERTY, further properties (and their values) can be set for this new relation. Therefore, the dropdown menu lists all available properties defined for the according asset type. - Finally, clicking on
Savecreates a new asset whileCanceldiscard any changes made.
Manually Deleting Relations
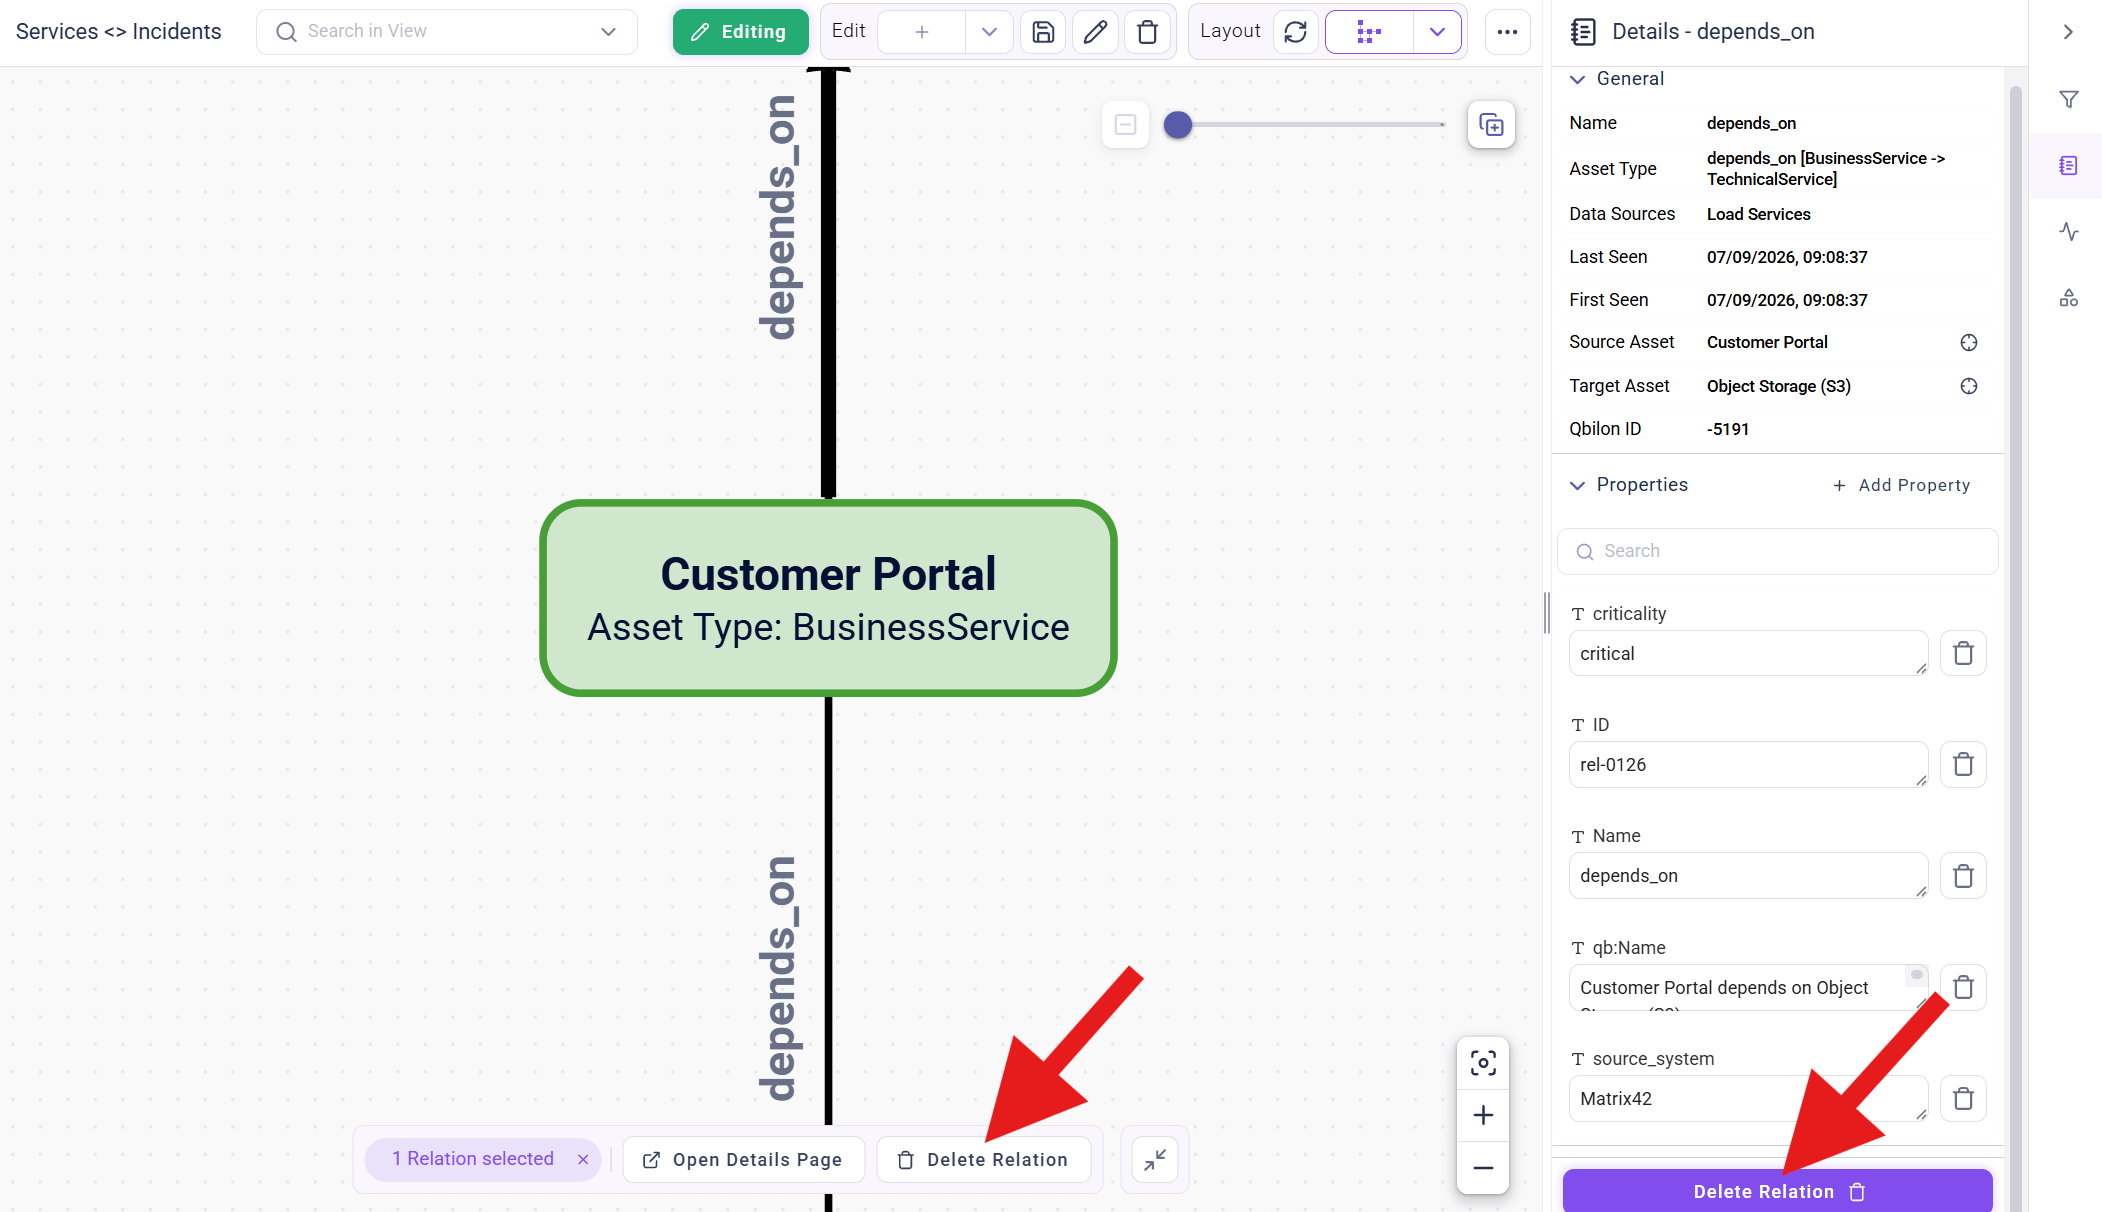
There are two ways to delete a relation:- Via the hover menu: clicking on the specific relation opens the hover menu that provides the
Delete Relationfunction. - Via the
Detailstab: Clicking on a relation opens the relation details on the right sidebar, which provides anDelete Relationfunction on the bottom.
Details panel (right arrow)
Tab “Filters”
Assets and Relations
Individually filtering shown assets and relations in the diagram view is possible via theFilters tab on the right sidebar. Here, selecting and deselecting the checkboxes within the Assets and Relations sections triggers a visualization update in diagram and table views.
Analysis
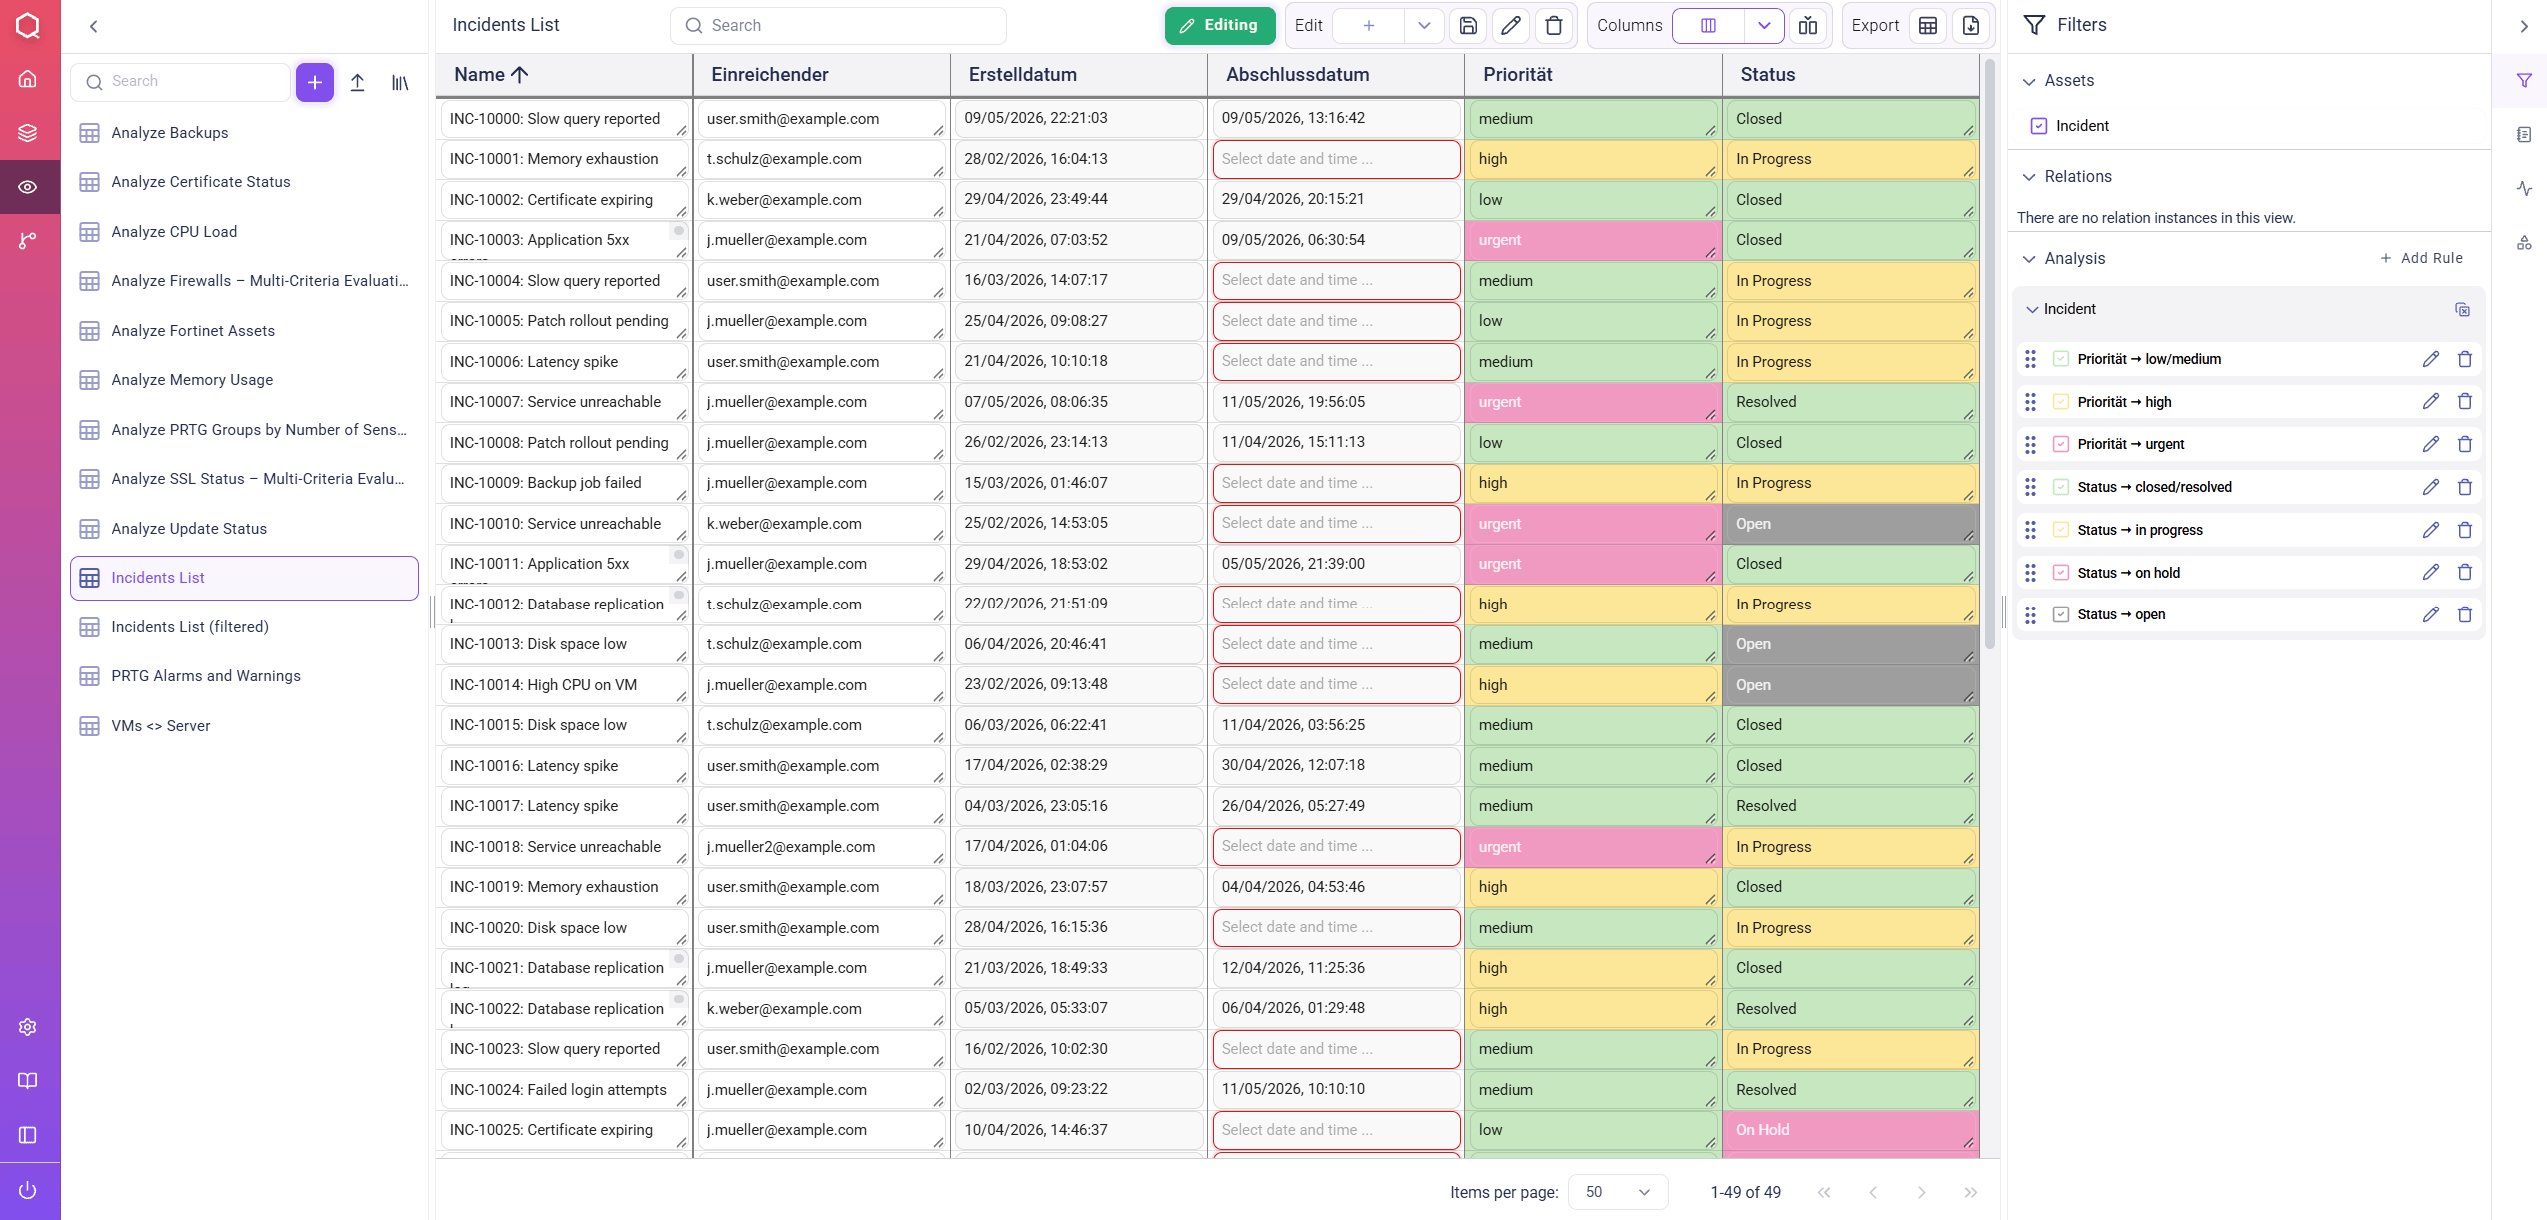
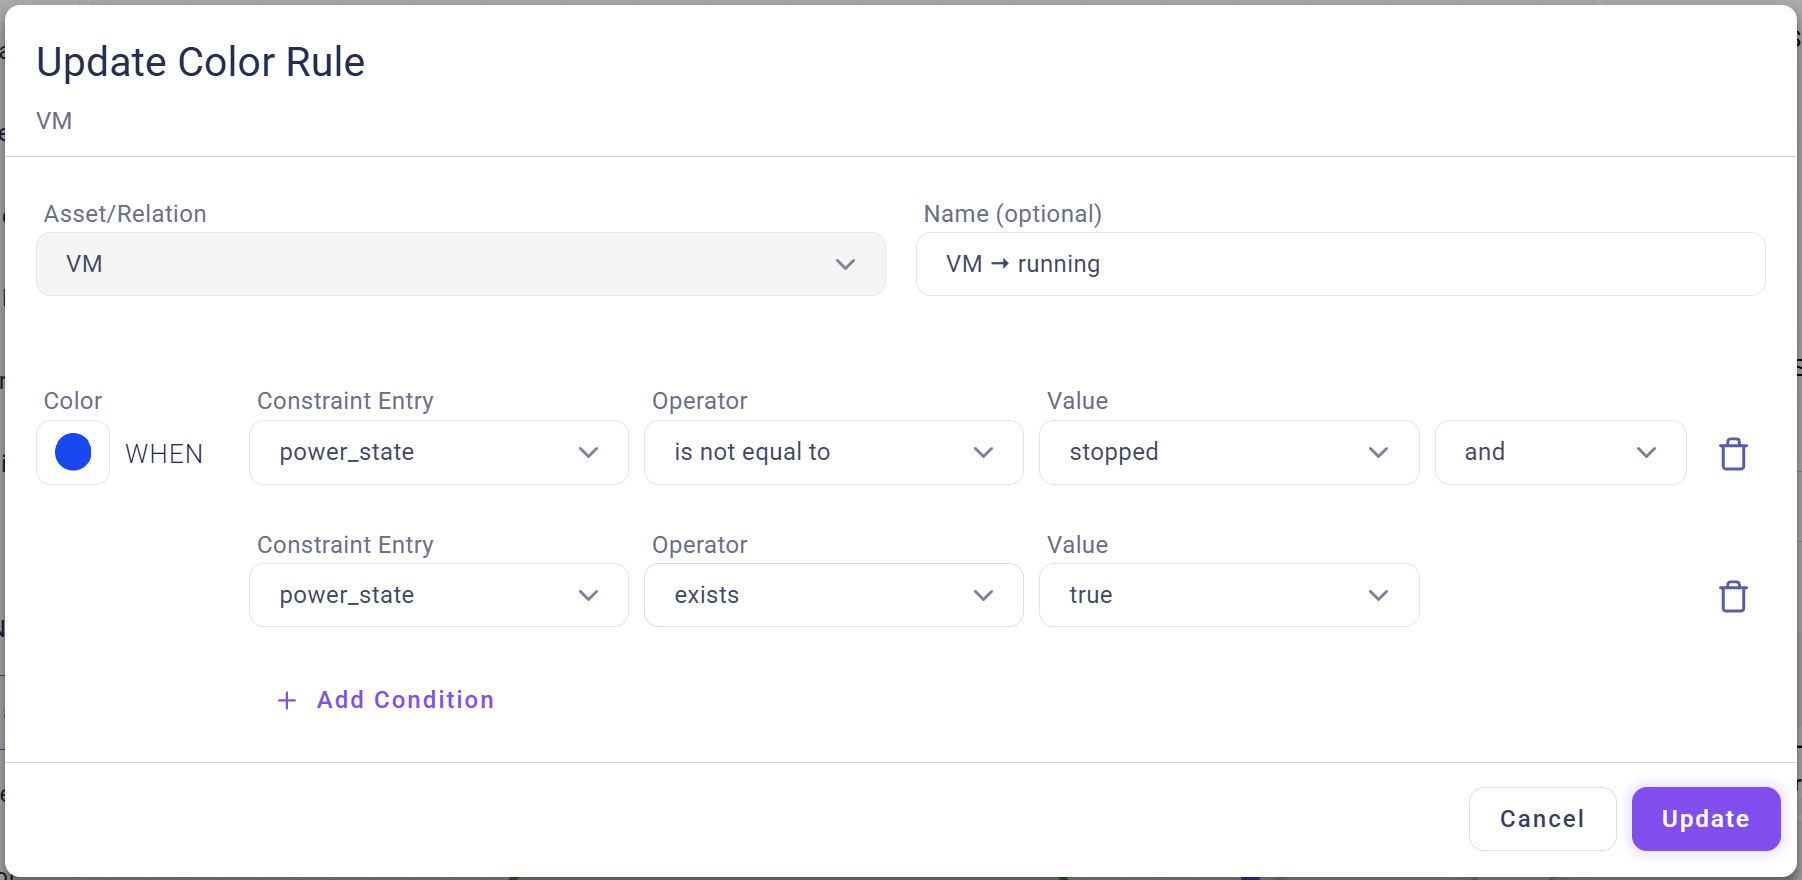
Within theAnalysis sections in the right sidebar, the + Add Rule button can be used to create analysis rules (coloring). Such rules are used to highlight assets that fulfill certain conditions depending on their properties.
Creating new analysis rules (coloring) is similar to creating filters:
Asset: the asset type for the analysis rule- Color Circle: color used for highlighting assets meeting the analysis rule conditions
Property: the asset type’s property used to later colorize the displayed relationsOperator(general): independent from the type of the selected property, these “general” operators are always available:is equal to: returns “true” if the property’s value corresponds to the entered/selected value,is not equal to: returns “true” if the property’s value does not correspond to the entered/selected value,exists: returns “true” if an optional property is existing for a specific asset/relation instance
Operator(specific): depending on the type of the selected property (Number,Text, …), different “datatype specific” operators are in addition available:- for text properties:
contains (not),matches (not)andis empty, - for number properties:
is >/< thanandis >=/<= than, - for
DateTimeproperties:before,after,within lastandnot within last.
- for text properties:
Value: the value to be set for the new property (clicking on the input field shows existing values)- Via
+ Add Condition, additional conditions can be defined for the analysis rule. If more than one condition is defined, the user can choose if …- colored assets have to fulfill every defined condition (connecting conditions via
AND) or - if they only have to meet one of the conditions (connecting conditions via
OR).
- colored assets have to fulfill every defined condition (connecting conditions via
Create adds a “analysis rule” to the Analysis list and automatically activates it.
If assets fulfill the conditions of more than one analysis rule, they are colorized according to the topmost activated rule (ascending priority).
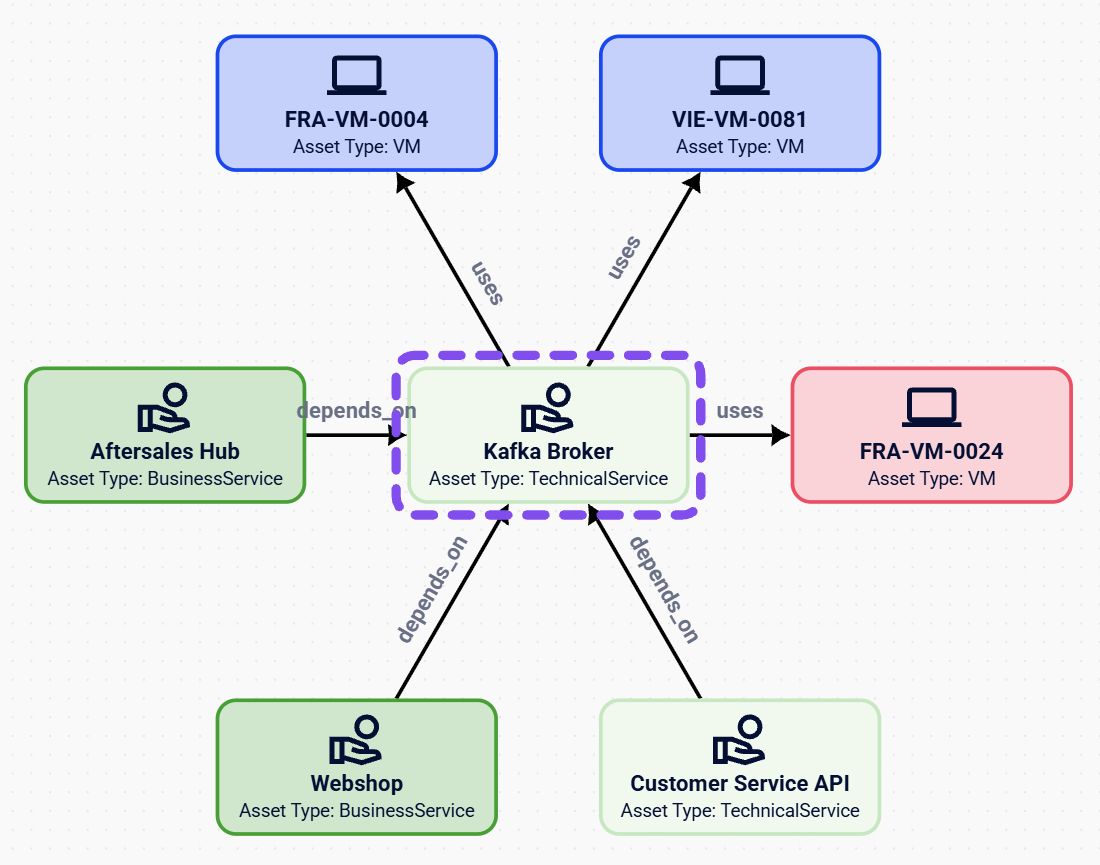
Tab “Details”
TheDetails section within the right sidebar shows all available information for one specifically selected asset or relation. In diagram views, clicking on the “empty space” of the visualization pane deselects the details tab.
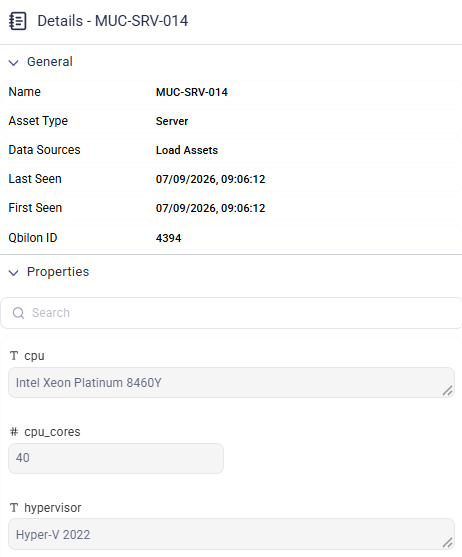
General Properties
Within theDetails tab in the right sidebar, basic properties for a selected asset/relation are shown in the General section:
| Name | Explanation |
|---|---|
| Name | the name is used as “primary tag” to display assets and relations in diagrams |
| Asset Type | specific type of an asset or relation |
| Data Sources | list of data sources that contribute information to this asset/relation |
| Last Seen | date and time when an asset/relation was last seen by Qbilon |
| First Seen | date and time when an asset/relation was first seen by Qbilon |
| Source Asset (only for relations) | “origin” asset of a relation (clicking on the  button sets the view focus on this asset) |
| Target Asset (only for relations) | “destination” asset of a relation (clicking on the  button sets the view focus on this asset) |
| Qbilon ID | unique asset/relation ID assigned by Qbilon |
Source Asset and Target Asset are only shown for relations.
Properties
Beneath theGeneral section, all additionally captured properties for a specific asset/relation are shown.
If the “edit mode” is activated, then it is possible to modify property values by clicking on the respective property value (input field surrounded by a dotted line) or to add further properties to the asset/relation (+ Add Property button in the Properties title bar).
Details are available within the “Edit Mode in Diagram and Table View” section at the beginning of this section.
Relations
For assets, theRelations section on the bottom of the Details tab lists all assets that are directly connected to the selected asset.
For each connected “neighbor” asset, an arrow icon indicates whether the respective relation (the dependency between a pair of assets) is “incoming” ( ) or “outgoing” (
 ).
Here, every existing relation of an asset is shown and not only those relations displayed within a specific view.
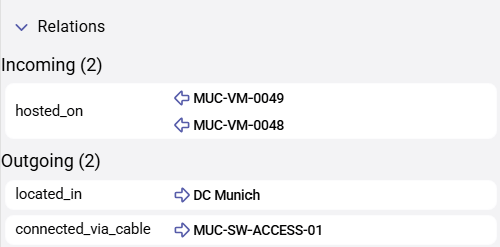
Tab “Activity”
TheActivity Tab on the right panel shows a complete change history for a specific asset or relation. This “audit trail” is important for multiple documentation and compliance standards and is thus immutable.
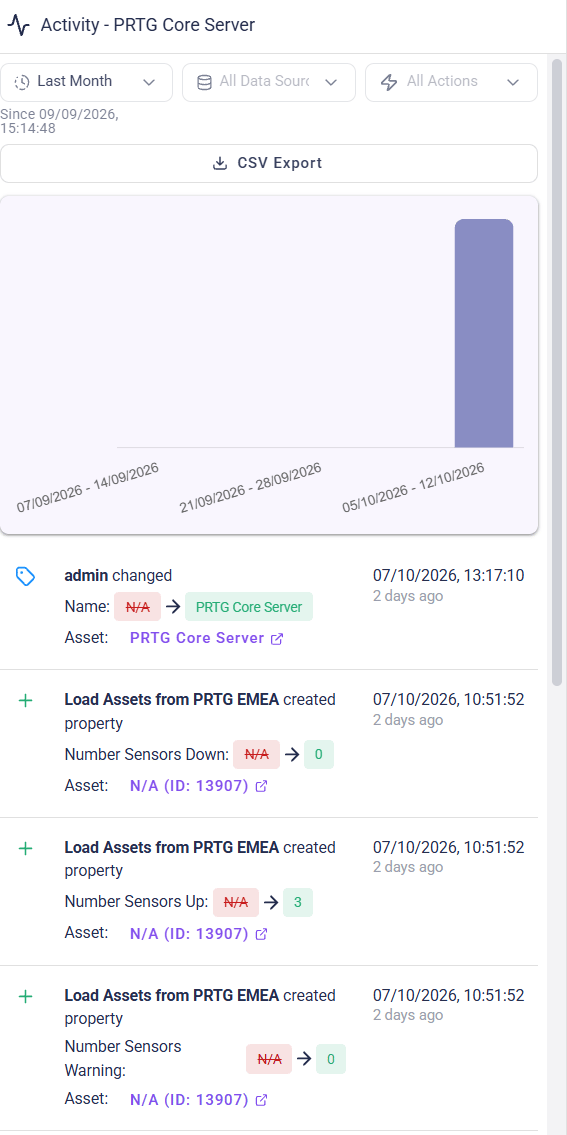
Tab “View”
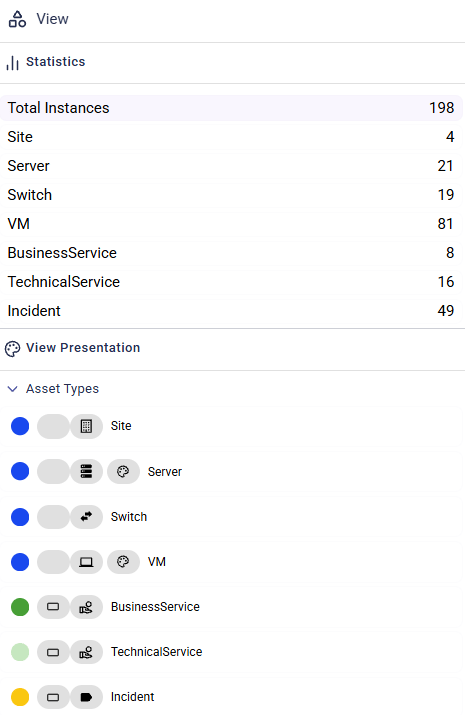
In diagram views, theView tab within the right sidebar shows all asset types and relation types included in the current diagram view.
Asset types and relation types are shown with …
- their particular color (circle on the left),
- their shape (e.g. the “node style” of assets or if relations are shown as line or container),
- their type icon and
- analysis rules associated with this asset/relation type (if they exist).
Importing Existing Views
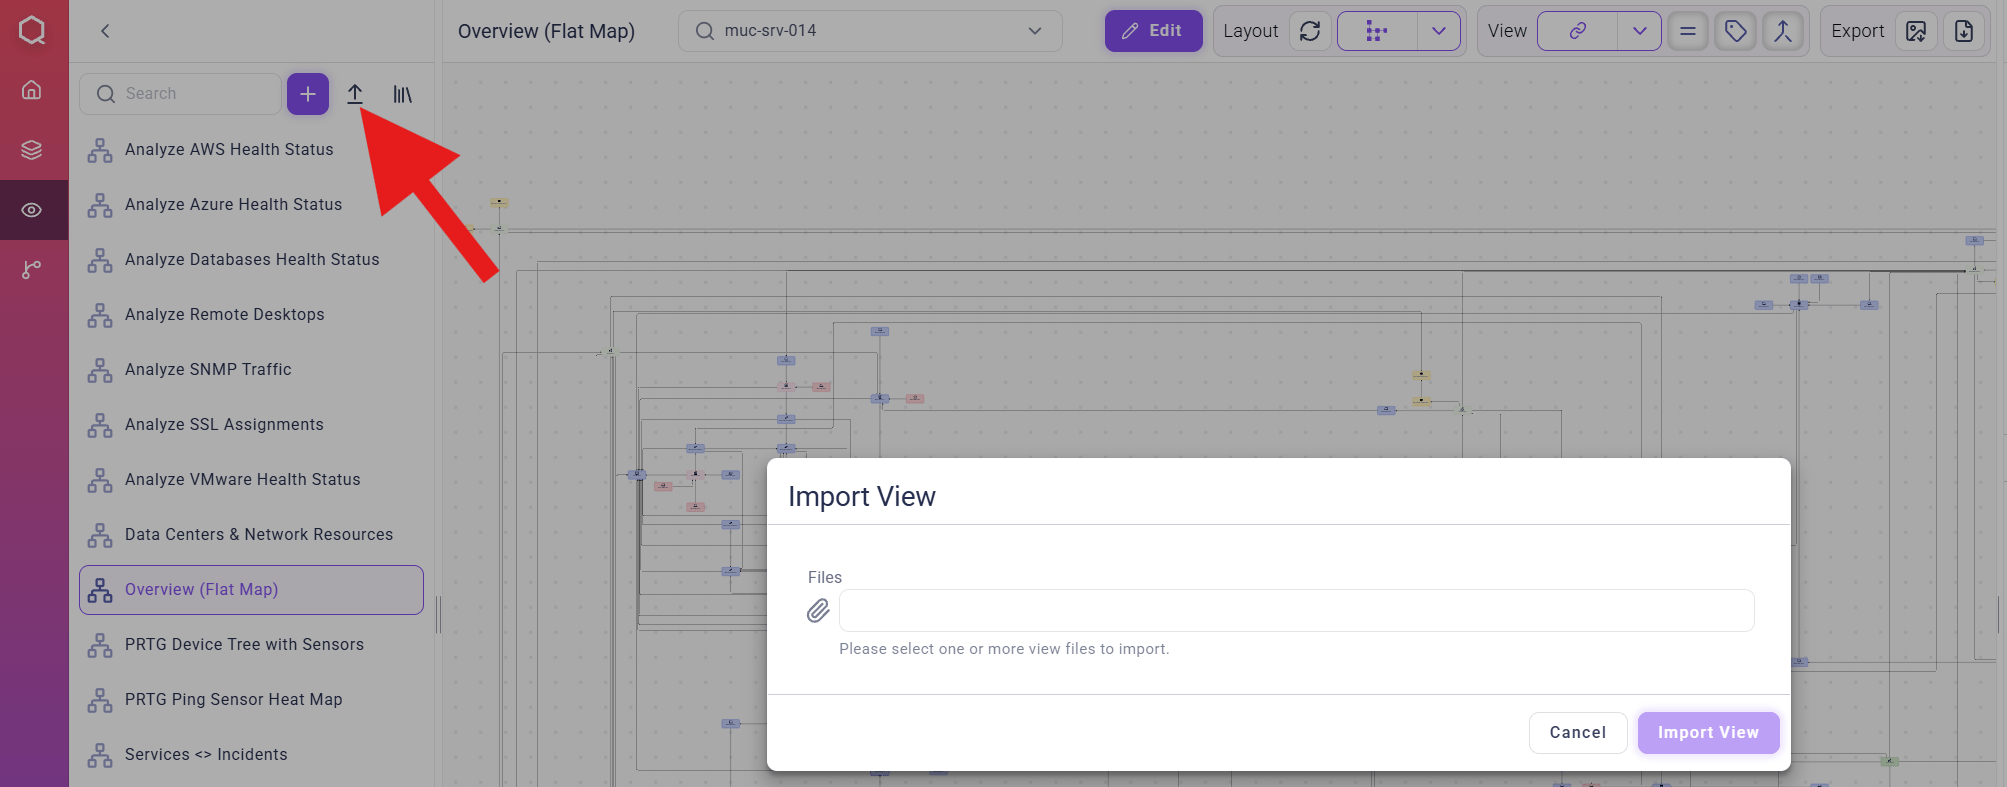
After navigating to theViews screen via the left navigation menu, previously exported views (.qb files) can be imported again. This can be done by clicking on the Import view button in the top right corner and by selecting one or more files to import.
After the import is finished, a short summary shows if it was successful. When closing the dialog (Ok button), the overview list is reloaded including the (successfully) imported views.